Why Choose a Mixing Machine for Your Business?
A Mixing Machine can turn separate ingredients into a consistent, repeatable product. That matters when every batch must match the last one. A dry powder blend may look uniform in the vessel, yet still fail during filling or testing. Mixing quality depends on blade design, speed control, vessel geometry, moisture, and product density. Small details matter.
Industry data supports this investment. Grand View Research identifies industrial mixers as a growing equipment segment, driven by food, chemicals, pharmaceuticals, and advanced materials manufacturing. Its market analysis highlights automation, process consistency, and reduced production time as major purchasing factors. PMMI’s State of the Industry reports also continue to emphasize labor efficiency, automation, and flexible machinery across packaging and processing operations. These findings suggest that a mixer is not merely a production tool. It can support broader operational resilience.
The practical benefits are visible on the factory floor. An operator can monitor torque, adjust speed, and record batch conditions instead of relying only on visual checks. A well-selected machine may reduce rework, shorten cleaning cycles, and protect product quality. However, the cheapest model is rarely the safest choice. That sounds obvious, but businesses still overlook maintenance access, sanitation requirements, noise, and future capacity. Equipment suppliers should provide documented performance data, material specifications, and validation support. Standards from organizations such as EHEDG and 3-A SSI can also guide hygienic design decisions. No machine solves a weak process by itself. Careful testing remains essential.
Define Mixing Machines by Process Type, Capacity, and Industry Application
Why Choose a Mixing Machine for Your Business?
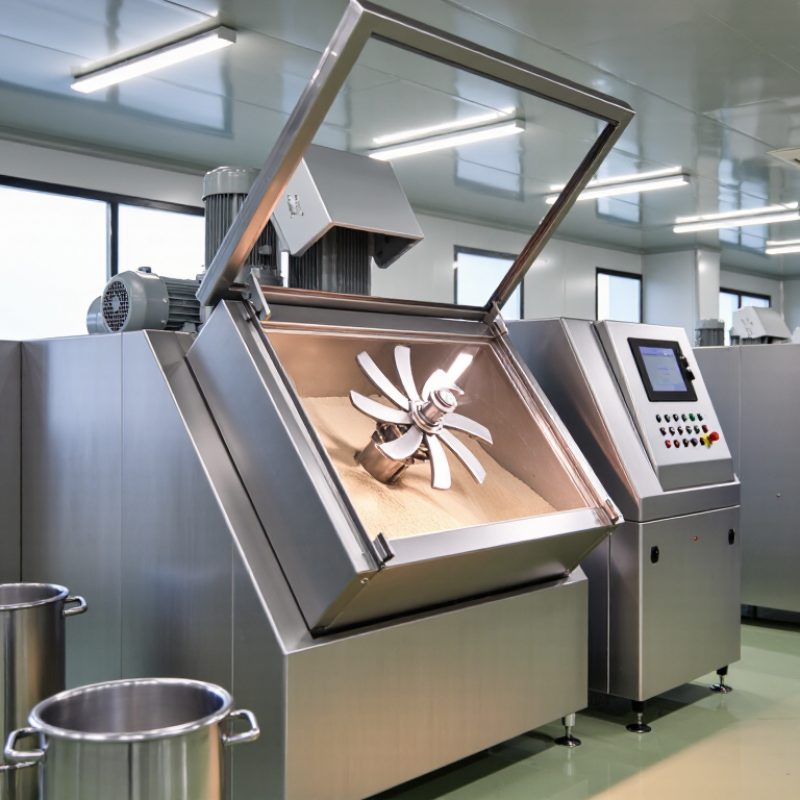
Mixing machines should be defined by process type, capacity, and industry application. Batch mixers suit products made in measured lots, such as dough, coatings, or powdered supplements. Continuous mixers support steady production and reduce pauses between material feeds. High-shear systems break down particles quickly, while paddle or ribbon mixers handle dry powders more gently. Vacuum mixing can reduce trapped air in creams, sealants, and thick pastes.
Capacity means more than the tank’s total size. A 500-liter vessel may not safely process 500 liters of material. Working volume, fill ratio, viscosity, and expansion all affect output. A small test mixer can reveal problems before a full-scale purchase. It may expose uneven blending, excessive heat, or difficult discharge. That step often saves money, though it can feel slow.
Industry demands also shape the design. Food processors may need smooth surfaces, controlled temperatures, and easy cleaning. Pharmaceutical production requires precise control, traceability, and validated procedures. Chemical plants may prioritize corrosion resistance and sealed operation. Construction materials often need strong torque for dense compounds. Cosmetics require gentle handling to protect texture and appearance. I once underestimated cleaning time in a production estimate. That mistake changed the equipment review. Operators also need practical access, safe controls, and replacement parts that can be obtained reliably.
Set Blend Uniformity Targets Using the Common RSD Threshold of ≤5%
Why Choose a Mixing Machine for Your Business?
Set Blend Uniformity Targets Using the Common RSD Threshold of ≤5%
A mixing machine can improve consistency, reduce manual variation, and support repeatable production. Its value depends on measurable performance, not appearance or capacity alone. Blend uniformity is one practical measure. The relative standard deviation, or RSD, compares variation between collected samples and the average result. Many operations use an RSD target of ≤5% as a useful benchmark. It is not a universal rule. Product properties, batch size, and testing methods may require a different limit.
Set the target before selecting equipment. Test the machine at its intended load, mixing time, and operating speed. Collect samples from different locations, including the top, center, and bottom. Use repeated tests to reduce the risk of a misleading result. Calculate the RSD for each trial, then compare the data with your quality specification. Results can mislead. Poor sampling can make a uniform blend look inconsistent, or hide real variation.
Look for adjustable controls, accessible inspection points, and clear operating records. A reliable supplier should provide test data and explain the test conditions. A single successful trial proves little. Some batches will drift. That is useful. Investigate changes in moisture, particle size, loading order, and mixing time. We should also question the 5% target when the process cannot consistently achieve it. Better decisions come from honest testing, documented deviations, and targets that match the product’s actual risk.
| Mixing Stage | Business Objective | Sampling Plan | Target Mean | Acceptable Individual Result | RSD Target | Decision Rule | Recommended Action |
|---|---|---|---|---|---|---|---|
| Initial Dry Mixing | Distribute the main powder and minor ingredients before liquid addition or further processing. | Collect 10 samples from representative locations, including the upper, middle, lower, center, and discharge zones. | 100% of the target concentration | 90%–110% of the target concentration | ≤5.0% | Accept when the RSD is ≤5.0% and the individual results meet the predefined range. | Increase mixing time only after checking fill level, impeller condition, and sampling technique. |
| Final Powder Blend | Achieve a consistent composition before filling, compression, packaging, or transfer to the next process. | Collect 10 samples at different time points and discharge locations. | 100% of the target concentration | 95%–105% of the target concentration | ≤5.0% | Accept when the mean is close to target and the RSD remains at or below 5.0%. | Review mixing sequence, powder flowability, segregation risk, and discharge configuration if results fail. |
| Liquid–Solid Dispersion | Disperse a solid ingredient uniformly throughout a liquid carrier and reduce concentration gradients. | Collect 10 samples from the top, middle, bottom, and outlet stream after the defined mixing time. | 100% of the target concentration | 90%–110% of the target concentration | ≤5.0% | Accept when sampling locations show no systematic high or low concentration pattern. | Check agitation speed, vortex formation, addition rate, and the risk of settling during sampling. |
| Liquid Blending | Produce a consistent liquid mixture for filling, coating, dosing, or downstream processing. | Collect 10 samples from multiple vessel heights and the discharge line. | 100% of the target concentration | 95%–105% of the target concentration | ≤5.0% | Accept when concentration uniformity is maintained from the vessel to the outlet. | Inspect impeller placement, tank geometry, recirculation, temperature, and viscosity changes. |
| Scale-Up Verification | Confirm that a larger mixing machine delivers comparable blend uniformity to the established process. | Use the same number of representative sampling points and the same analytical method used during development. | 100% of the target concentration | Within the approved process specification | ≤5.0% | Accept when scale-up results meet the predefined uniformity and process-performance criteria. | Compare power input, mixing time, fill ratio, shear, and material-transfer conditions with the smaller scale. |
| Routine Batch Monitoring | Maintain repeatable quality and identify drift before it affects production output. | Use a documented sampling plan with periodic checks at defined critical locations. | 100% of the target concentration | Within the approved process specification | ≤5.0% | Accept when the result meets both the individual-value specification and the RSD limit. | Trend RSD, mean concentration, mixing time, load size, and equipment settings for continuous improvement. |
| Calculation reference: Relative Standard Deviation (RSD) = Standard Deviation ÷ Mean × 100. The ≤5.0% value is a commonly used blend-uniformity target; the final acceptance criteria should be established according to the material, process, analytical method, and applicable quality requirements. | |||||||
Compare Batch and Continuous Mixers by Throughput, Energy, and OEE Metrics
Why Choose a Mixing Machine for Your Business?
Compare Batch and Continuous Mixers by Throughput, Energy, and OEE Metrics
Choosing a mixer starts with production reality, not catalogue capacity. Batch mixers suit varied recipes, frequent changeovers, and strict operator control. They can handle small runs without keeping a line continuously loaded. Continuous mixers perform better when demand is steady and material properties remain consistent. They feed, mix, and discharge with fewer interruptions. High output matters.
Throughput should be measured as usable product per hour, not theoretical capacity. A continuous system may reduce energy per tonne because it avoids repeated starts and stops. However, idle conveyors, poor feeding, or excessive mixing can erase that advantage. Batch equipment may consume more energy during heating and discharge, yet its flexibility can prevent costly overproduction. Energy meters should be installed near the mixer, not estimated from monthly utility bills.
OEE connects these choices to daily performance. Track availability during cleaning and changeovers, performance against the rated rate, and quality losses from rework. A mixer with impressive throughput can still deliver weak OEE if operators wait for upstream materials. A clean spreadsheet can mislead. Small stoppages often disappear in weekly reports. Review downtime by shift, recipe, and material moisture. Then test both systems under comparable loads before committing. The best choice may be less obvious than expected.
Evaluate Compliance with GMP, FDA 21 CFR, ATEX, and IEC 60204-1
Why Choose a Mixing Machine for Your Business?
Compliance should be assessed before comparing speed, capacity, or purchase price. GMP requires equipment to support cleaning, maintenance, and consistent production under 21 CFR Part 211. A mixing machine should have smooth, accessible surfaces, validated operating ranges, and documented materials. Ask for test records, calibration certificates, and change-control evidence. Paperwork matters.
FDA 21 CFR Part 11 also affects machines with electronic recipes or production records. Access controls, audit trails, secure backups, and reliable timestamps must be verified. Deloitte’s 2024 Smart Manufacturing and Operations Survey found that 86% of manufacturers consider smart manufacturing important for future competitiveness. That value disappears when data cannot withstand an audit. A screen is not automatically a compliant record.
For sites handling combustible dust or vapors, ATEX assessment must match the hazardous zone, equipment category, temperature class, and ignition risks. IEC 60204-1 adds requirements for electrical equipment, emergency stops, wiring, and control-circuit safety. The machine should include a clear risk assessment and practical inspection points. Test the emergency stop with gloves on. That detail is easy to miss. I would also challenge vague claims such as “GMP-ready” unless the supplier defines the scope and supporting evidence. Compliance is not a decorative label; it is a chain of design decisions, operator training, verification, and maintenance. Performance may still vary after installation, especially when powders bridge or cleaning time expands. That uncertainty deserves documented trials.
Why Choose a Mixing Machine for Your Business?
Evaluate Compliance with GMP, FDA 21 CFR, ATEX, and IEC 60204-1
This chart maps the primary compliance focus of each framework for industrial mixing equipment. GMP and FDA 21 CFR mainly address hygienic production, materials, documentation, and process control. ATEX focuses on equipment used in potentially explosive atmospheres, while IEC 60204-1 addresses the electrical equipment and safety of machinery. A value of 1 indicates direct relevance to the listed area; it does not represent certification or a compliance score.
Calculate Total Cost of Ownership, Payback Period, and 10–20% Capacity Reserve
Why Choose a Mixing Machine for Your Business?
Calculate Total Cost of Ownership, Payback Period, and 10–20% Capacity Reserve
Choosing a mixing machine requires more than comparing purchase prices. In real production, electricity, installation, cleaning, labor, maintenance, and downtime shape the total cost of ownership. Record current batch times and energy use. Ask suppliers for service intervals and spare-part estimates. A low-cost machine can become expensive when cleaning takes an extra hour each shift.
Payback depends on measurable benefits, not optimistic promises. Divide the total installed cost by annual savings and added gross profit. For example, a machine costing $60,000 may create $30,000 in yearly benefits through faster batches, lower labor hours, and reduced waste. Its estimated payback period is two years. Check this calculation against production records. Some savings may never appear if demand remains weak.
Plan for a 10–20% capacity reserve. A machine running at its limit may struggle with thicker materials, larger batches, or seasonal orders. If normal demand requires 100 kilograms per hour, consider equipment rated for 110–120 kilograms. That spare capacity can protect delivery schedules and reduce mechanical stress. Do not oversize blindly. An oversized vessel may increase energy use and cleaning time. This is where careful judgment matters. My own estimates would include a sensitivity check, because maintenance delays and changing order volumes can make a neat payback model look less certain.